
One thing we can all agree on is there was an affordability vibe to the midterm election. Accordingly, a federal permitting bill is front and center of the Senate floor debate right now (figuratively speaking). I’ve written elsewhere on estimating the impact of such a reform.

But good or bad, that bill won’t do much to directly affect the cost of housing, which is the old man at the affordability party. Being from NY, having spent my career in DC, and now relocated to the Bay Area, I’ve lived something of a high home price tour de force.
I wanted to put some numbers on it and hopefully tease out the share of prices attributable to local policies, costs which are therefore solvable. Costs are a combination of labor and materials, availability of space, demand owing to job growth, as well as local zoning and other regulations. That last component constitutes the “policy wedge” on housing prices.
The results of this exercise are unsurprising: large coastal urban centers tend to exhibit the biggest price wedges while Rust Belt and interior cities have the lowest or no effective wedge.
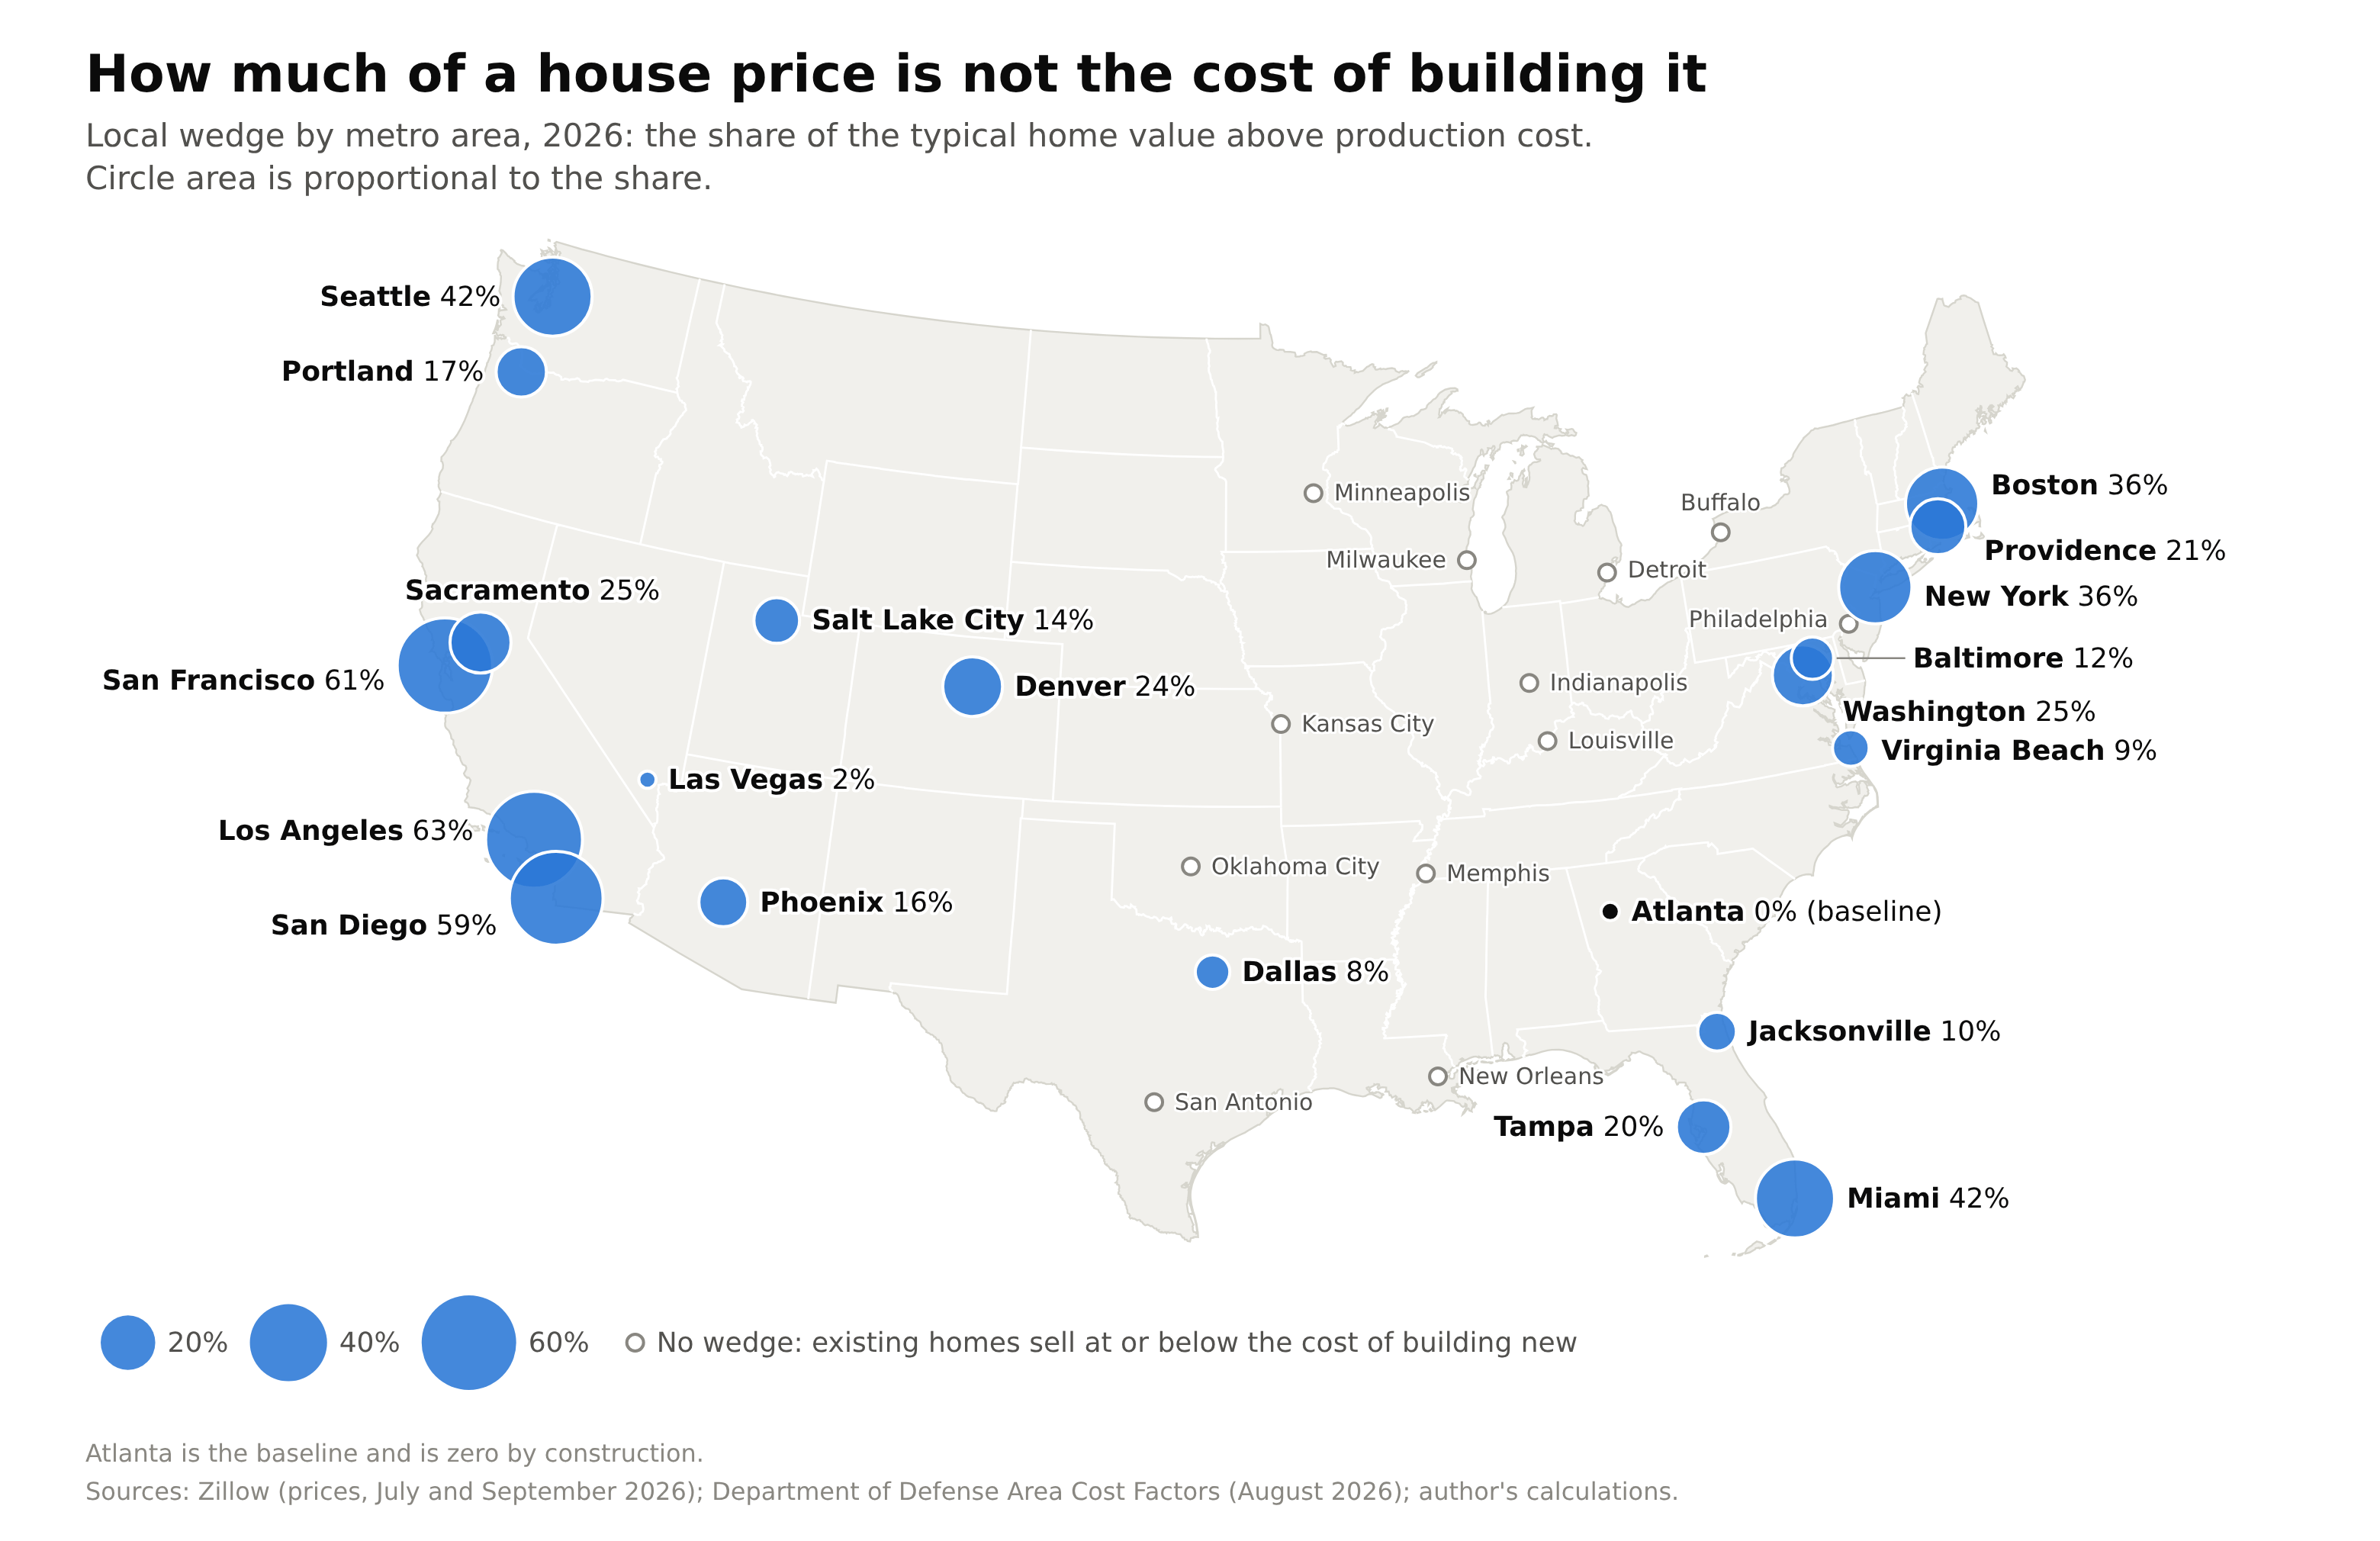
Below I briefly explain how I worked through these numbers and what they mean.
Estimation
Setup
The wedge is the part of house price that is neither physical construction cost nor the land’s shadow price in its current use. Under free entry in homebuilding, the price of a house (P) decomposes as:
P = Cc + qA + Z
where Cc is construction cost, q is the value an owner places on an additional square foot (intensive margin), A is lot size, and Z is the premium a builder pays for the same land with the right to build (extensive margin). If unconstrained, owners would sell to builders until the two margins equalized, such that Z = 0.
In other words, Z is the “price of permission.”
So we endeavor to estimate the value of Z in today’s market and policy environment.
Parameters
P - price per square foot (P0 = Atlanta median price per square foot of newly built homes, treated as the zero-wedge baseline)
Cm - minimum profitable production cost (construction cost plus unconstrained land value)
cm - construction cost index for metro m; national = 100 (c0 = Atlanta’s index)
τm - local wedge: share of price in metro m attributable to local factors other than construction cost = 1 − Cm/P
Benchmark. In a market with no binding restriction, competition drives price to Cm. Glaeser and Gyourko (2018) estimate it from construction costs, a land share of 20 percent of total cost, and a 17 percent gross margin. Here it is taken from a baseline market instead.
Baseline (Atlanta). Gyourko and Krimmel (2021) find only a small zoning tax there (median $15,111/quarter acre, or about 7 percent of house value, versus 49 percent in San Francisco), so its new-home price per square foot, P0, is treated as approximating production cost. Each metro’s minimum profitable production cost (Cm) is given by:
Therefore the local wedge is the share of the price above that cost:
So you can take what a new house costs in Atlanta, adjust for how much more it would directly cost to build in a given metro (differences in actual construction costs), and any price above that is the local wedge.
Results
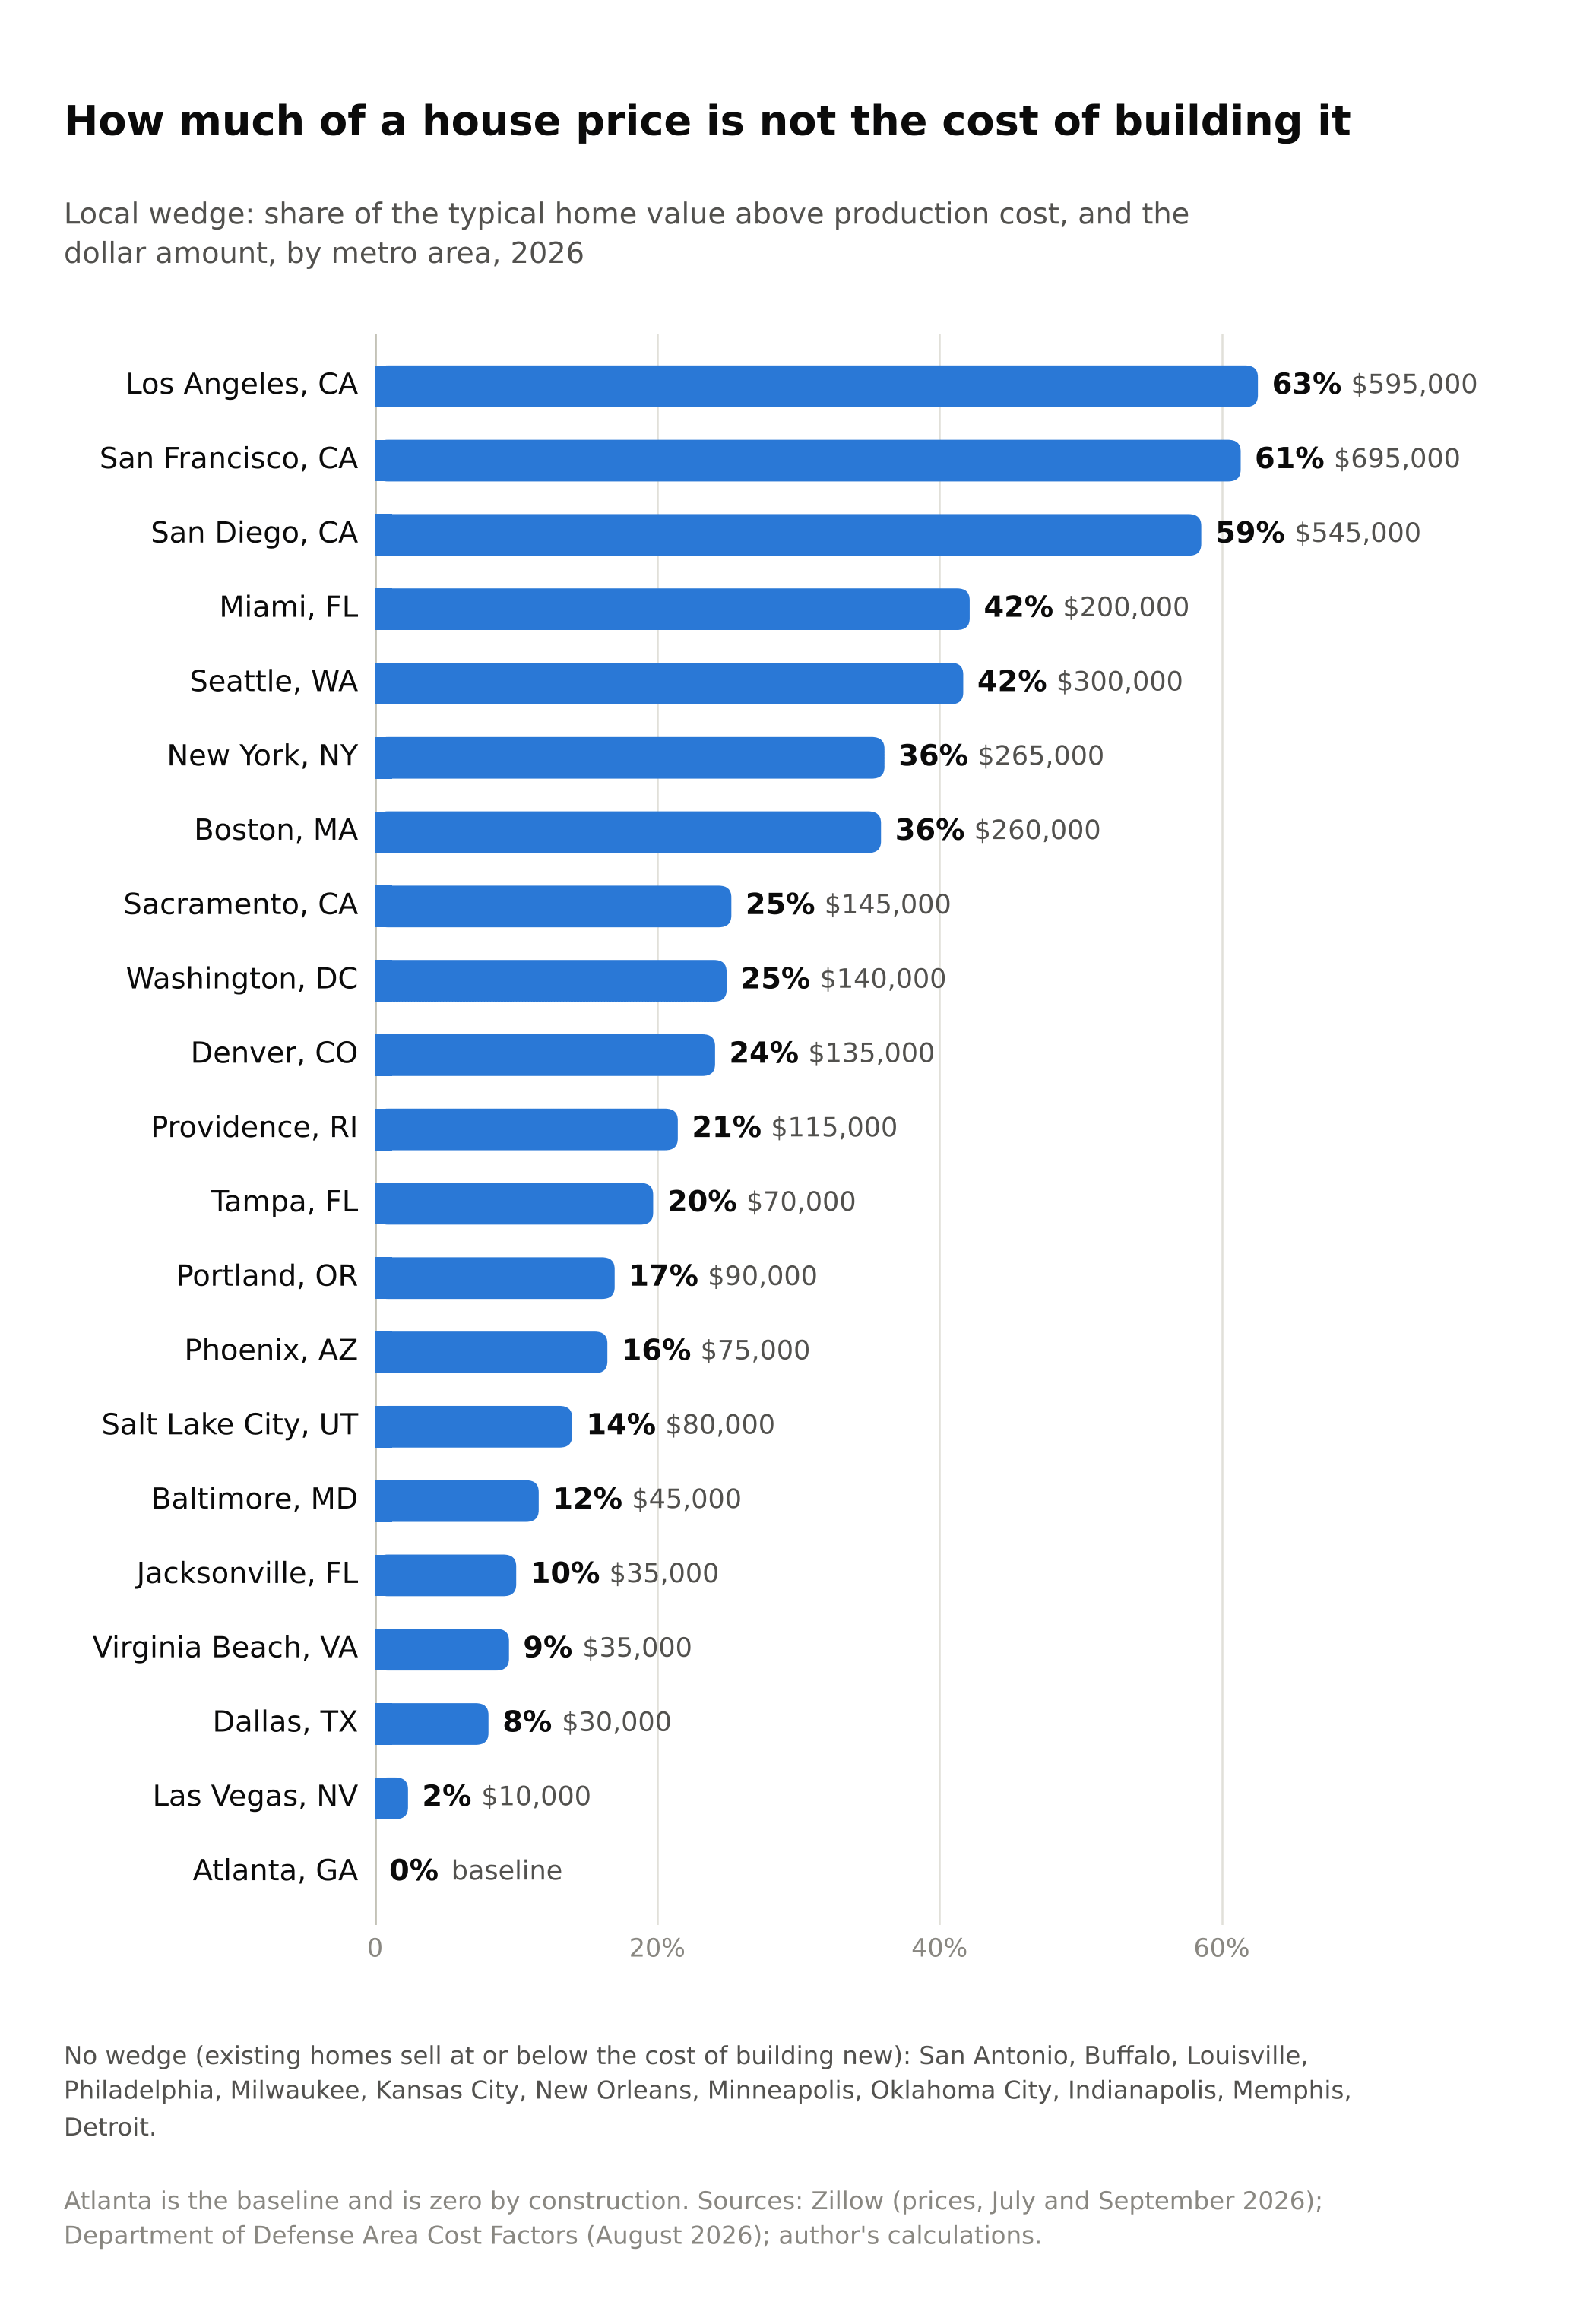
This estimate however does not account for scarcity of land, so this measure accounts for more than policy-induced price effects and should be treated as a ceiling on policy’s effect.
For comparison and as a check, Gyourko and Krimmel (2021), using data up to 2018, isolate the zoning component directly from land prices. Per quarter acre:
San Francisco, CA: $410,000
Los Angeles, CA: $199,000
Seattle, WA: $175,000
New York, NY: $152,000
Philadelphia, PA: $77,000
Washington, DC: $60,000
Portland, OR: $55,000
Boston, MA: $46,000
Miami, FL: $38,000
Phoenix, AZ: $22,000
Atlanta, GA: $15,000
Denver, CO: $13,000
Detroit, MI: $10,000
Minneapolis, MN: $4,000
Dallas, TX: $2,000
The rank-ordering for the most part is consistent with the estimates above, but again are measuring two different things.
Sources
Edward Glaeser and Joseph Gyourko, “The Economic Implications of Housing Supply,” Journal of Economic Perspectives 32, no. 1 (2018): 3–30. Joseph Gyourko and Jacob Krimmel, “The Impact of Local Residential Land Use Restrictions on Land Values Across and Within Single Family Housing Markets,” Journal of Urban Economics 126 (2021): 103374. Zillow, “New Homes Now Cost Less Than Existing Ones in One-Third of Major Markets” (September 29, 2026), for median price per square foot by metro, July 2026. Zillow, “September 2026 Market Report,” for typical home values by metro. U.S. Army Corps of Engineers, “DoD Area Cost Factors,” PAX Newsletter No. 3.2.1 (August 18, 2026), for construction cost by metro.
The author is nonresident senior fellow at the Foundation for American Innovation
Comments